


Studying hydrologic characteristics
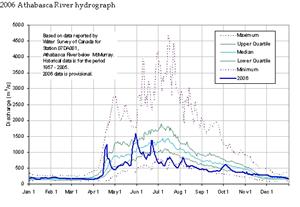
Descriptions of hydrologic characteristics are usually defined for a particular location along the course of a stream or river. Annual hydrographs are graphs that show changes in flow over the year at a specific location. Using a hydrograph, it is possible to show flow variation and to identify periods of high flows and low flows. Data collected to describe flows are called hydrometric data.
A range of hydrologic indicators is often used to describe normal and extreme flow conditions. Some of the indicators commonly used include:
- Discharge, the flow passing a particular cross-section of the river channel, measured in cubic meters per second (m3/s).
- Maximum flow, the highest flow recorded for a particular day from all years of flow records.
- Minimum flow, the lowest flow recorded for a particular day from all years of flow records.
- Median flow, the recorded flow value at which 50% of recorded flows for a particular day are greater, and 50% of recorded flows are lower.
- Upper quartile, the recorded flow value at which 25% of recorded flows for a particular day are greater, and 75% of recorded flows are lower.
- Lower quartile, the recorded flow value at which 75% of recorded flows for a particular day are greater, and 25% of recorded flows are lower.
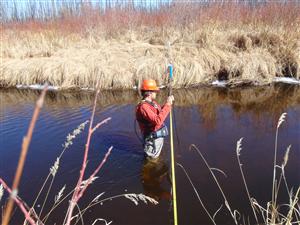
Hydrometric monitoring (the collection of information to describe surface water conditions) is often done through a combination of field work and the use of remote monitoring equipment. Specialized field personnel often measure discharge at stations throughout the year to establish a relationship between water flow and water levels at a specific site. This relationship is called a rating curve. Continuous water level recording instruments installed at the station can provide water level data, which are then used in combination with the rating curves to compute a set of daily discharge data. Data from these sites provide valuable information for use in hydrologic assessments of remote areas.